Receive Alan's free Market Commentary every month and weekly educational videos (you can unsubscribe at any time).
How to find rising shares
... with the Hull ROAR Indicator

When the stock market is rising it means there are rising shares within that market. But all those shares will be rising at different rates. So how do you find the fastest rising shares?
With the Hull ROAR indicator you can measure and filter out the fastest rising shares.
ROAR stands for 'Rate of Annual Return', and this provides a strong clue as to what the indicator calculates. The rate of annual return is calculated by taking the annual increase in price activity and dividing by the current share price. The result is multiplied by 100 to convert it to a percentage.
Here is an example...
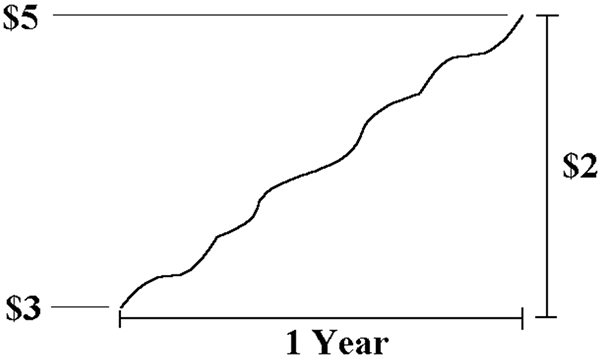
- Lets assume a share is climbing at a rate of $2 per year
- The current price of the share is $5
- The 'Rate of Annual Return' would be 0.4 ($2 divided by $5)
- Converting this to a percentage we get 0.4 x 100 = 40%

Now some people question this calculation insisting that the formula should be $2 divided by $3 = 60%. However, this is the historical rate of return rather than the current rate of return. So, for investors, looking to buy into a rising share, the current rate of return is more relevant.
If this measurement is applied to all shares that are rising, then we can see which ones are moving the fastest.
Now we need to get a little more specific about the design of the ROAR indicator. Rather than use the change in value over one year, which is a little blunt, we can take a sample over a shorter time frame and annualise the result. And, to provide a degree of smoothing, the price values can be taken from a moving average like the Hull Moving Average or using linear regression.
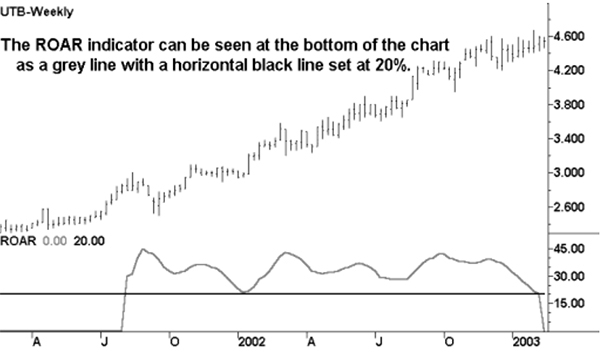
The Active Investing strategy, which is a medium to long term trend trading strategy, employs a ROAR indicator using linear regression for measuring price activity and with the calculation done over a 6 month time frame. An example of this is shown in the chart below.

You can see that UTB enjoyed a rate of annual return of between 20% and 45% throughout 2002. The horizontal bar placed at 20% is being used as a cutoff level. Searches can be performed using the ROAR indicator to sift out shares that have a rate of annual return higher than a particular cutoff.
The Active Trading strategy, which is a short to medium term trend trading strategy, uses another variation of the ROAR indicator based around the following criteria.
- 3 month time frame
- Hull Moving Average to measure the price activity
- Cutoff = 80%
The following formula for the Hull ROAR Indicator (Active Investing style) is for MetaStock but it can be easily adapted for use with other charting programs that are capable of custom indicator construction.
