Receive Alan's free Market Commentary every month and weekly educational videos (you can unsubscribe at any time).
An introduction to Multiple Moving Averages
Multiple moving averages are a fairly modern development in technical analysis and that’s because you certainly wouldn’t want to draw them by hand. Thankfully, today we can easily create them with the help of modern charting software and as you know they are an invaluable aid in assessing a the quality of price trends.
Multiple moving averages, as the name implies, are a series of moving averages all drawn on the same chart with different but usually evenly spaced periods. And when creating an MMA chart it is a common practice to hide the underlying financial instrument as I have done in the following chart (ie. the actual price activity isn’t displayed, only the MMAs)…
MMA chart created using 10 evenly spaced periods

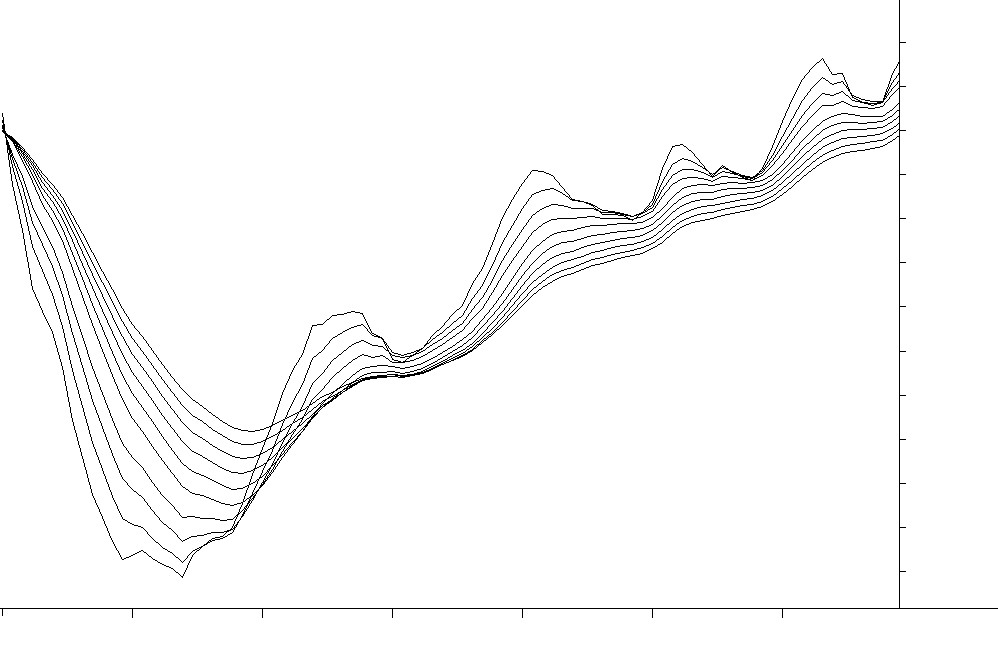
As you can see by placing a series of moving averages on the same chart with evenly spaced period values, it forms a ribbon that filters out the short term price movements but highlights the underlying trend. This technique was adopted several decades ago by Daryl Guppy, an internationally renowned share trader and best selling author, who came up with the idea of splitting the ribbon into two distinct groups.
Thus the shorter term group of averages would represent the shorter term traders in the market whilst the longer term group would represent the more conservative, longer term traders and investors. Daryl prefers using exponential moving averages and employs MMA charts in a variety of different ways but principally for trend analysis.
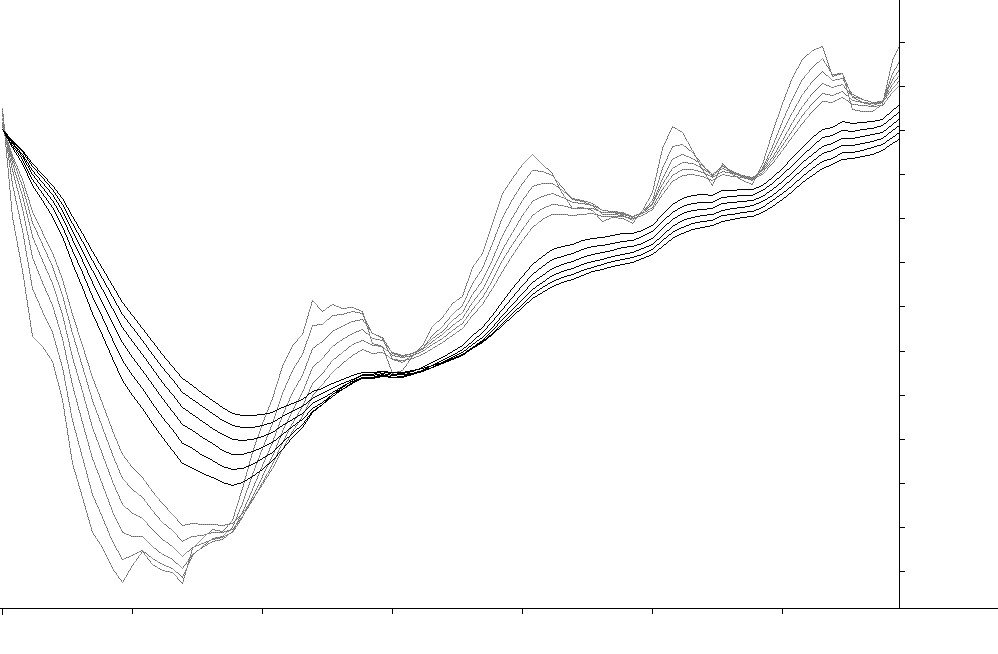
However the one way in which Daryl and I differ is that he trades with daily charts whilst I use weekly charts. Because of this we invariably use different periods and so on a weekly basis I recommend using 3, 5, 7, 9, 11, 13, 21, 24, 27, 30, 33 & 36 weeks. The following is an example of a weekly MMA chart…
Weekly MMA chart created using EMAs, with the
shorter term group in grey and the longer term group in black

Now that I’ve covered their construction, let’s turn our attention to their application which is qualitative as opposed to quantitative. Essentially I use MMA charts to judge the quality of a trend, my principle concern being the degree of volatility in the price behaviour. Let’s start by looking at an ideal trend where there is a little bit of short term volatility but all the lines on the chart are remaining relatively straight, evenly spread out and parallel to each other.
MMA chart showing an ideal trend with very low volatility

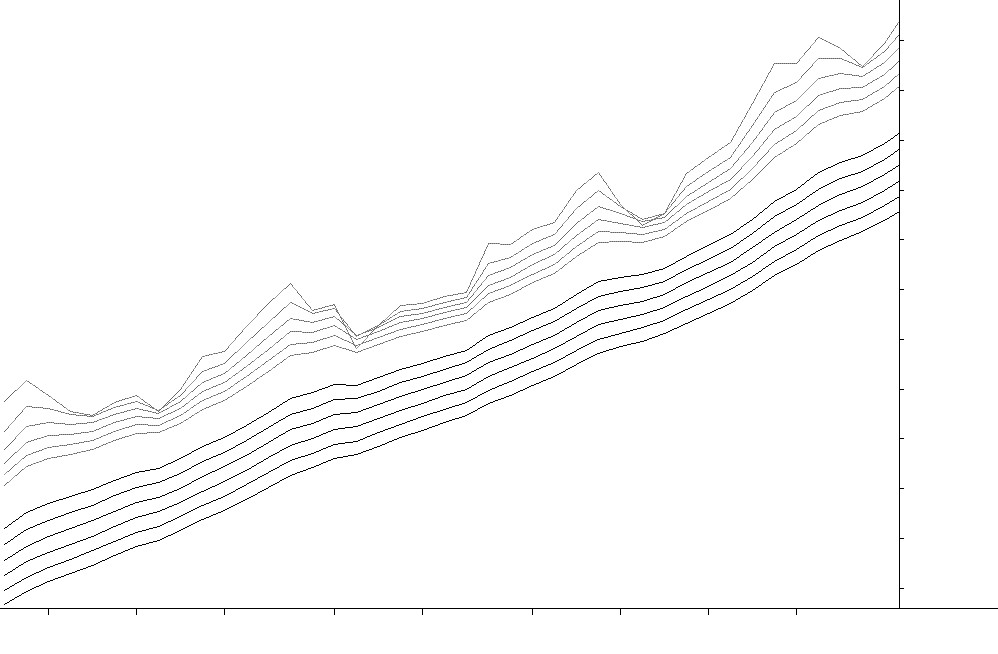
Looking at the short term group of averages, you can see how the market runs and then pulls back, over and over again. This is normal trending behaviour as markets constantly rally and then rest, repeatedly. But it should be a nice even and regular pattern that isn’t too violent. If it is very aggressive then it indicates that the very short term traders have a strong influence over the market and, as a result, the trend is inherently unstable. So let’s look at this type of situation where the price activity has far too much short term volatility and would therefore be considered as unstable.
MMA chart showing an unstable trend

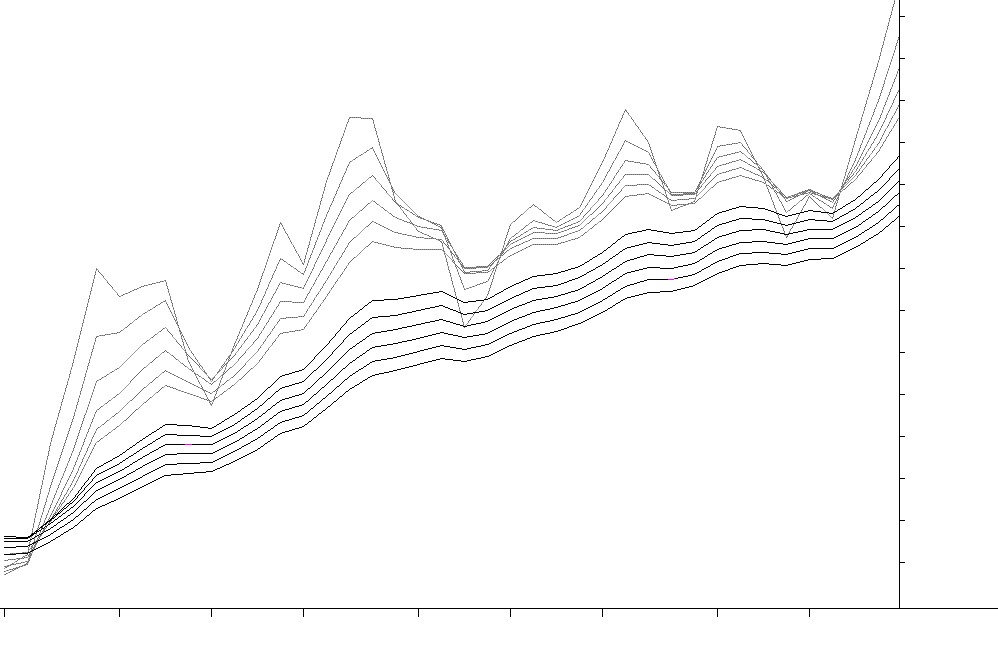
So I would buy into the ideal trend but not into the unstable one as it is far less likely to survive, in my opinion. And there’s the kicker…in my opinion. Analysing MMA charts is entirely discretionary and requires a considerable amount of practice if you want to do it well. Hence MMA chart interpretation is more akin to an art than a science.