How to analyse a trend trade
...using support and resistance levels
This clip is an excerpt from ALAN HULL TV which is a weekly video newsletter. For more information click here
Alan reviews a stock market chart of APN using technical analysis.
Support & resistance play a key role in this analysis. Alan looks for a potential trade and, if appropriate, sets a target and a stop loss for trade management.
In this scenario, the trend looks good in the medium term. Over the previous year, the price is trending nicely. It rallies and rests, rallies and rests - an indication of an attractive trend.
However, as the chart is widened, there is some serious cause for concern. Looking back 2 to 3 years there is some historical support and resistance at the price level where the reviewed action is heading. There is support at 90 cents and resistance at $1. This forms a danger zone for the price moving forward.
Alan suggests entering the trend at the reviewed stage would not be a good idea. Better to wait until the danger zone is passed and the price rises clearly above $1.
Tip: check for historical support and resistance when reviewing a chart for a trade
Support and Resistance
Support is a where the price finds a lower price level it struggles to fall through. A support level acts like a lower boundary. This can be a round currency level or any significant price level for the individual stock. The price tends to bounce off support and either track along near it or it might reverse off the support level and start a new up trend. The more times the price rejects the support level the more valid that support level becomes.
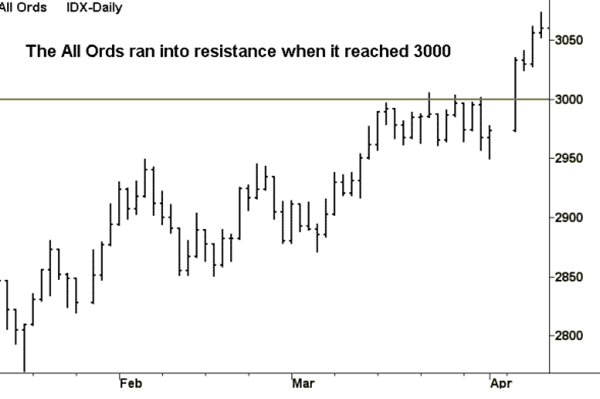
Resistance is similar but acts as an overhead boundary that price struggles to push through, see chart below for an example.

