How to identify the end of a trend
...using Dow Theory
This clip is an excerpt from ALAN HULL TV which is a weekly video newsletter. For more information click here
Alan reviews a chart of FLT and shows how to determine the end of a trend using Dow Theory.
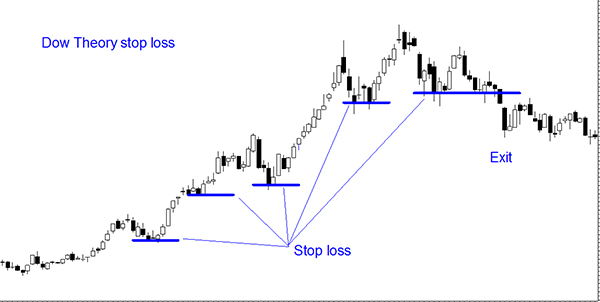
In this example, the price was trending nicely, making higher highs and higher lows. According to Dow Theory is defines a rising market.
However, the price action changes and begins to make outside swings; that is, a higher high and a lower low. When this happens the market is classified as sideways. Therefore the chart in review changes from a rising trending market to a sideways one.
In the price action following the analysis the price makes a lower low and then continues lower becoming a falling market.
Dow Theory
Therefore, using Dow Theory, the chart in review changes from rising to sideways to becoming a falling market, see chart below.

