How to enter a trend trade
...and curve fit a moving average
This clip is an excerpt from ALAN HULL TV which is a weekly video newsletter. For more information click here
Alan reviews a stock market chart of TNE using technical analysis.
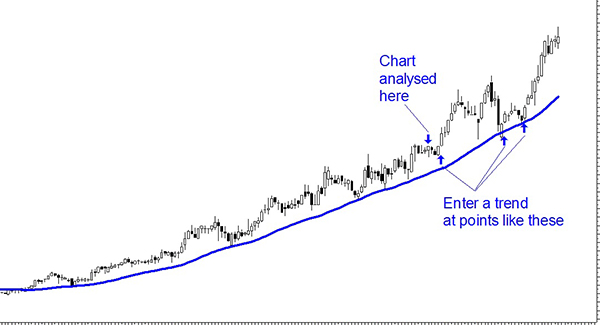
In this review, the trend is well established and looking good. Alan suggests using a curve fitted moving average to manage the trade. To do this, place a simple moving average on the chart and adjust the period until the moving average is sitting nicely just under the price action.
In this case, a 35 week simple moving average (35-week sma) does the trick. The adjusted moving average acts as a stop loss for this trade. This means, when in the trade, and exit should be made if the price falls below the moving average.
When entering into a well-established trend such as this it is generally worth waiting for a dip and a rise in the price rather than when it is elevated. In this review the price is well above the stop loss - the 35-week sma. Therefore, Alan suggests waiting until the price falls closer to the stoploss and then rises. Well established trends often continue onwards so there is generally time to wait for a better entry.
The chart below shows some possible entries into the trend where the price has fallen towards the stop loss and then had an up week.

Click here for more articles and videos
